Yesterday I lead a fun session at Wherecamp PDX. I’d been working on a Halloween costume of the late great Bob Ross so I embraced it and in the classic format of his PBS show Joy of Painting I took people through creating and publishing a map in just a half hour.
There. It’s just that easy.
|
|
Check out the interactive final product below complete with happy trees, clouds, squirrels, and a heatmap of furry travels as they forage and build giant acorn stashes. I used some of my favorite tools including the new Mapbox Studio, Sketch, The Noun Project, and QGIS. We then published the map as a simple web app using React and Firebase. I did not create the data however. Can you guess what I used? civicapps.org was my friend this time.
I hope you enjoy and read on for some of my workflow details.
The Blank Canvas
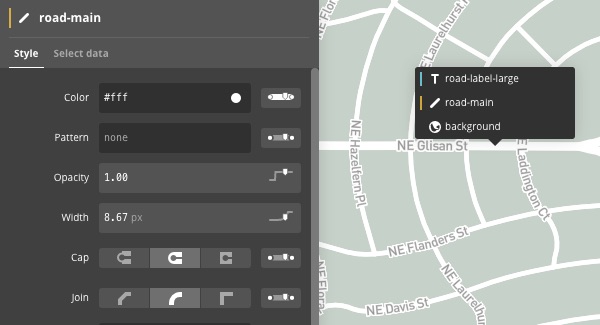
In Mapbox Studio your blank canvas will often be one of the pre-styled global street maps lovingly extracted from OpenStreetMap by the Mapbox team. I chose the light basemap to focus the viewer on the data I was going to layer on top. I then made the background color a little warmer and toggled off the display of any unnecessary layers including buildings and most labeling. Studio has a nice feature where you can click any feature on the map and jump right into editing its style. This is expected in graphic design software, but a global basemap? This is a pretty big leap forward.
Icon Design
All of my icons I found at The Noun Project. Seriously they have icons for everything. You can use any of them for free if you give credit.
- Tree created by Matthew Hawdon
- Squirrel created by Andy Beksa
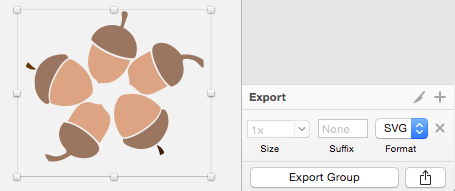
- Acorn created by Proletkult Graphic, GB
- Cloud created by James Fenton
- Rain created by Lloyd Humphries, DK
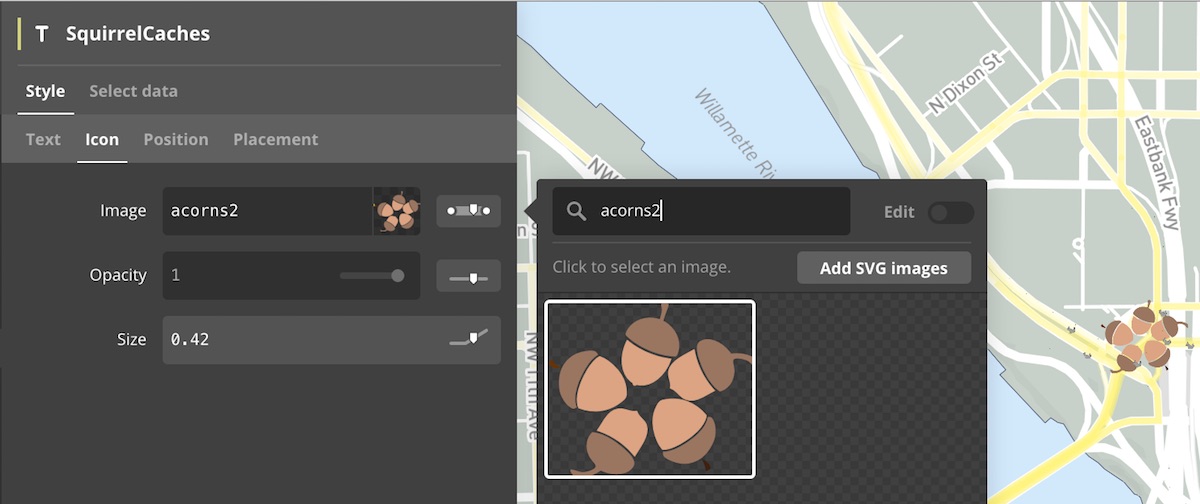
I was able to import each icon in SVG format directly into Sketch, my vector editing tool of choice next to Inkscape. Sketch is not a full-blown vector editor but I’m able to adjust color and size as well as duplicate and mash them up into new icons. The final product is then exported as a new SVG and imported into Studio. Some nice features are available for choosing what zoom levels the icons should appear at and how they should scale in size as you zoom in and out. Very slick.
Data
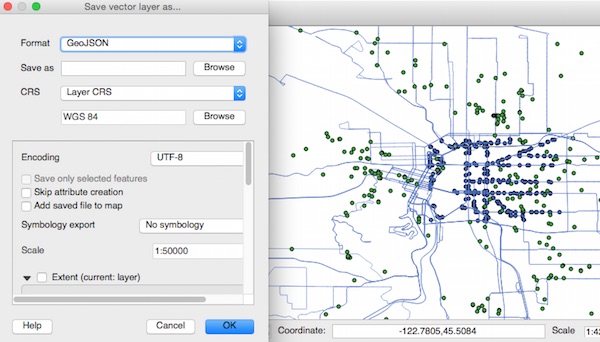
I found all of the data I needed at Portland’s civicapps.org. To load it into Mapbox Studio I only needed to convert it to the WGS84 reference system (longitude/latitude decimal degrees) from the local Oregon State Plane system. Quantum GIS easily did this by loading the dataset and saving as GeoJSON WGS84.
The Polish
To finish the map off I added some linework for squirrel paths. These styled semi-transparent, maybe only 20% opacity, so that where multiple paths overlapped there would be more intense color, signifying you know higher density squirrel traffic ;)
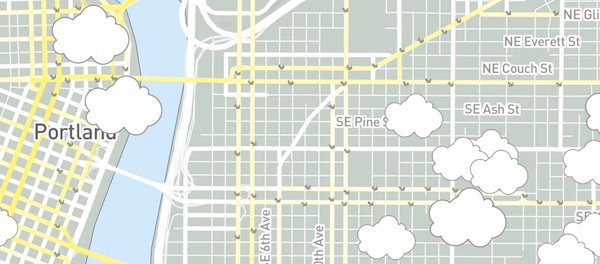
I also added in some clouds that vary in size based on their size attribute. The clouds also appear and disappear as you zoom in and out giving a more interactive feel. Completely for show but an interesting touch I think that takes interactive maps to another level.
The App
But wait we’re not done yet. Once the map style is published we’ve just gotten started. The map style is now available via the Mapbox style API and can be consumed by any mapping library that support the style and vector tiles spec. For this example I used the Mapbox GL Javascript library and wrapped it into a simple React app that I put together. It’s not production-ready code but if React is your framework of choice it lets you get a map up and running in the browser quickly and get a feel for how it will work on a variety of devices. Nice!
With just a few more steps you can then publish this little app prototype on the web using the Firebase static hosting service. The interactive map above is my published map that I put into an iframe.
There’s much more you can do with the GL JS library including interacting with map features, filtering and restyling layers on-the-fly, tilting and rotating the map, and more. I’m currently working on a production-ready starter project using the GL JS library, React, and webpack. Keep an eye on the Github repository for more.
Wrap
So that’s it, I hope you enjoyed getting a glimpse into one possible workflow. I have high hopes for this software stack and look forward to publishing some production apps in the coming months. Until next time.