For the last couple months I’ve been prototyping a simple solution for collecting temperature and humidity data using an Arduino and visualizing it online in real-time. It’s been a fun experience from soldering connections and writing Arduino sketches in C to publishing data to the Thingspeak IoT platform and designing a simple web interface for aggregating and visualizing the data. It’s still a work in progress but I’m ready to share some of my initial work.
All of the code including the Arduino Sketch and Angular app can be found on my Github project
Hardware
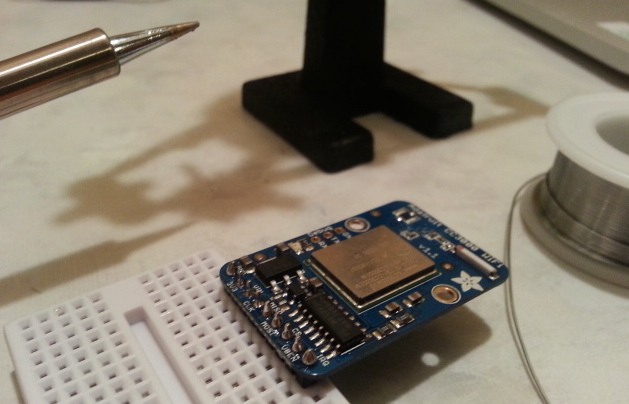
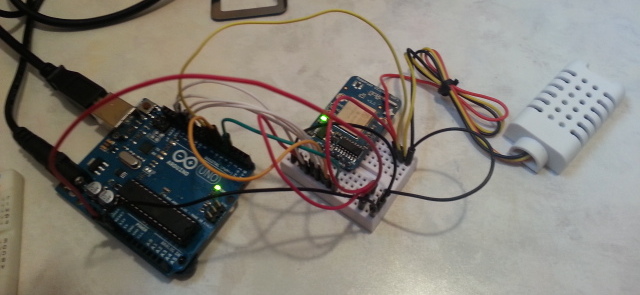
For the hardware I selected the Arduino Uno R3 microcontroller, AM2302 temperature/humidity sensor, and Adafruit CC3000 Wifi Breakout Board. With all the right parts I was able to put this together in a couple of hours.


Thinkspeak
The next step was to write an Arduino Sketch to collect data from the sensors at a regular interval and send it to Thingspeak over WiFi. For this I adapted an older Adafruit tutorial.
Thingspeak made it easy to setup a new channel to receive the sensor events for both temperature and humidity. Once the sketch was setup I watched the data start to stream in.
App Design
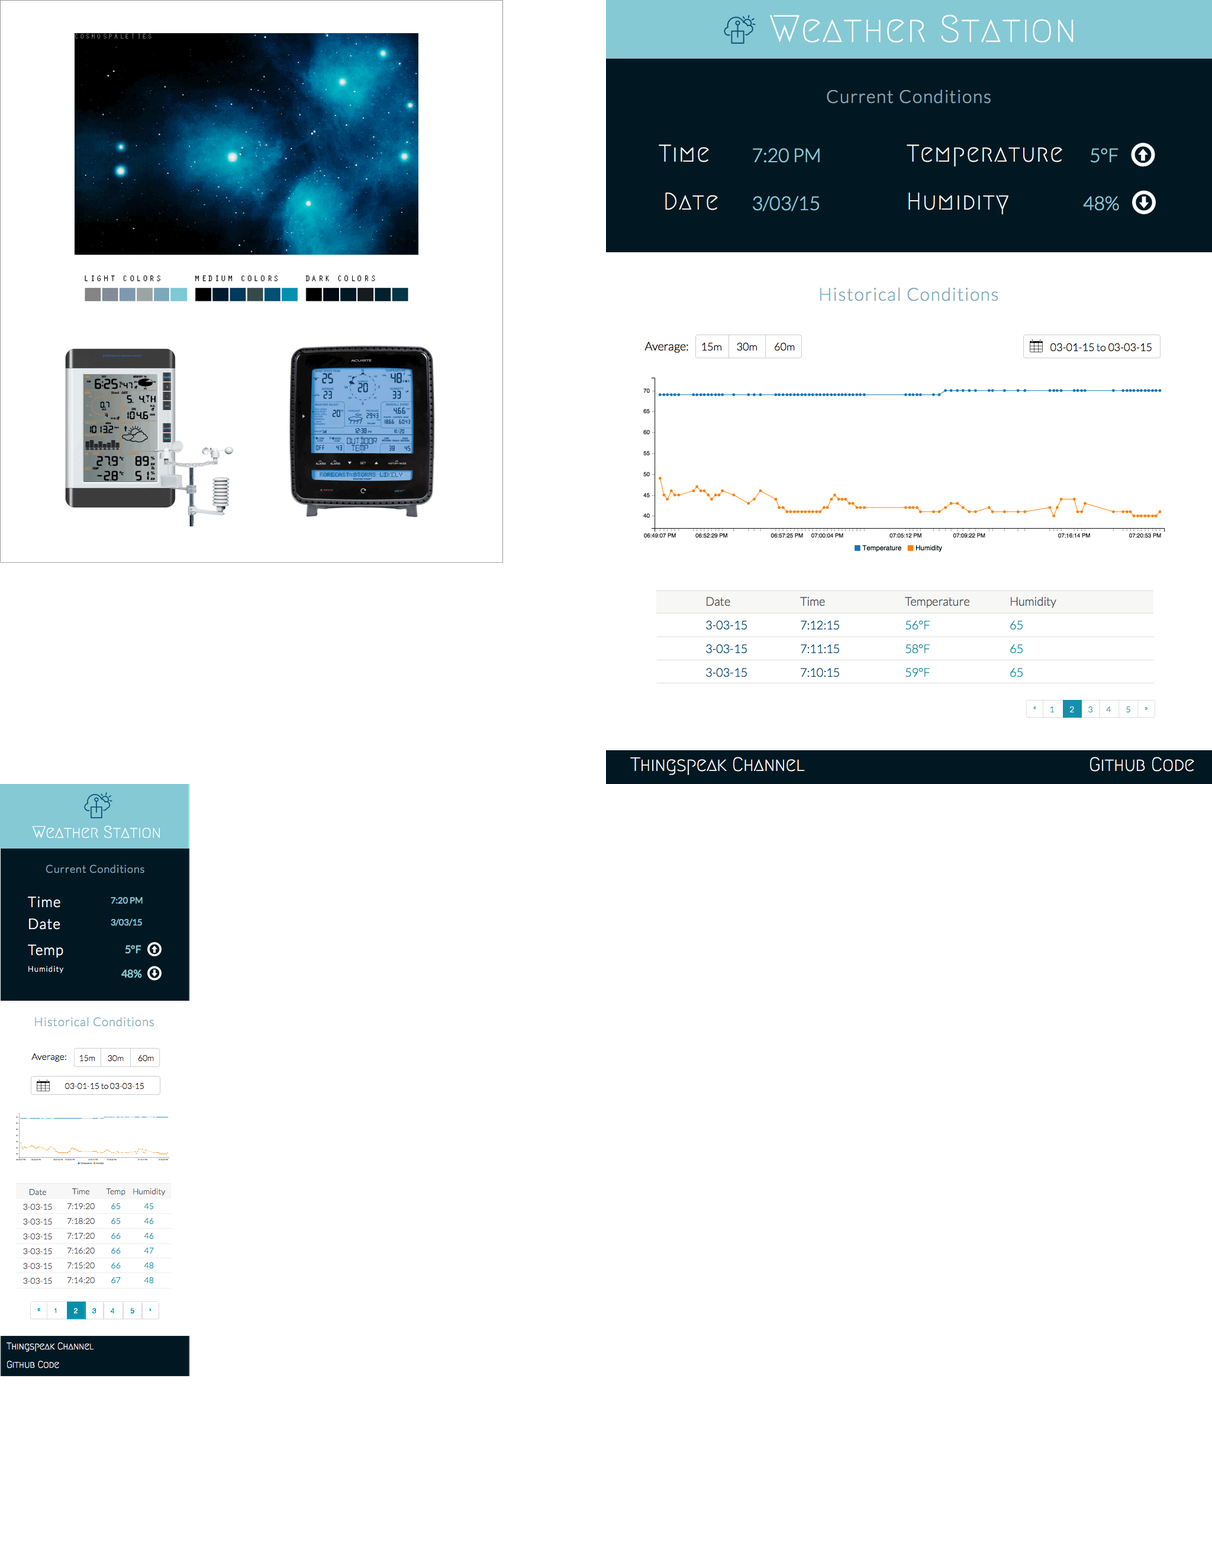
I was just about ready to design the UI, but first I took some time to study the the aggregation features of the Thingspeak API as well as test out the C3.js charting library. Confident of what these tools could do I found a deep space themed palette and sketched out a UI design.

App Development
With the groundwork now laid I’m slowly moving forward with the prototype in my spare time. I’m going to incorporate a variety of front-end tools including:
- Bower
- Gulp
- SASS + Sourcemaps
- Autoprefixer
- Bootstrap
- Angular JS
- Karma test runner
Stay tuned for the final results.
