I have a soft spot for landslide data. One of my first open source web mapping projects back in 2007 involved visualizing some of the first LIDAR-based landslide assessments done for Portland by the Oregon Department of Geology and Mineral Industries (DOGAMI). It was exciting times back then creating online interactive maps for the general public that used PostGIS, Mapserver, and PHP.
So I was pleased to see this last week that DOGAMI released version 3 of Statewide Landslide Information Database for Oregon (SLIDO) with the extent of over 37K historical landslide deposits! A great dataset to take for a spin with some different open source tools, starting with QGIS.
Reading File Geodatabases with QGIS
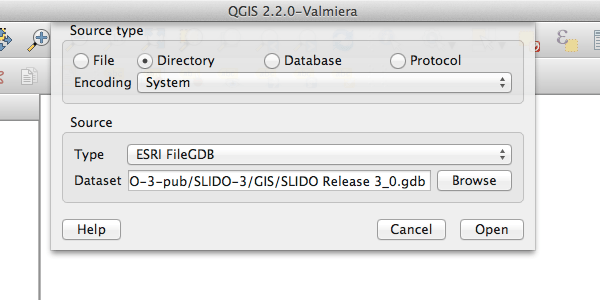
The landslide data is made available as a 900MB ESRI File Geodatabase. QGIS offers support for this format using GDAL’s FileGDB Driver. For those on Windows using QGIS with OSGEO4W, you may already have this support built-in. Otherwise you’ll need to add in the filegdb library.
For those of us using Kyng Chaos’ QGIS build for OSX, you’ll find a separate plugin for this on the GDAL page.
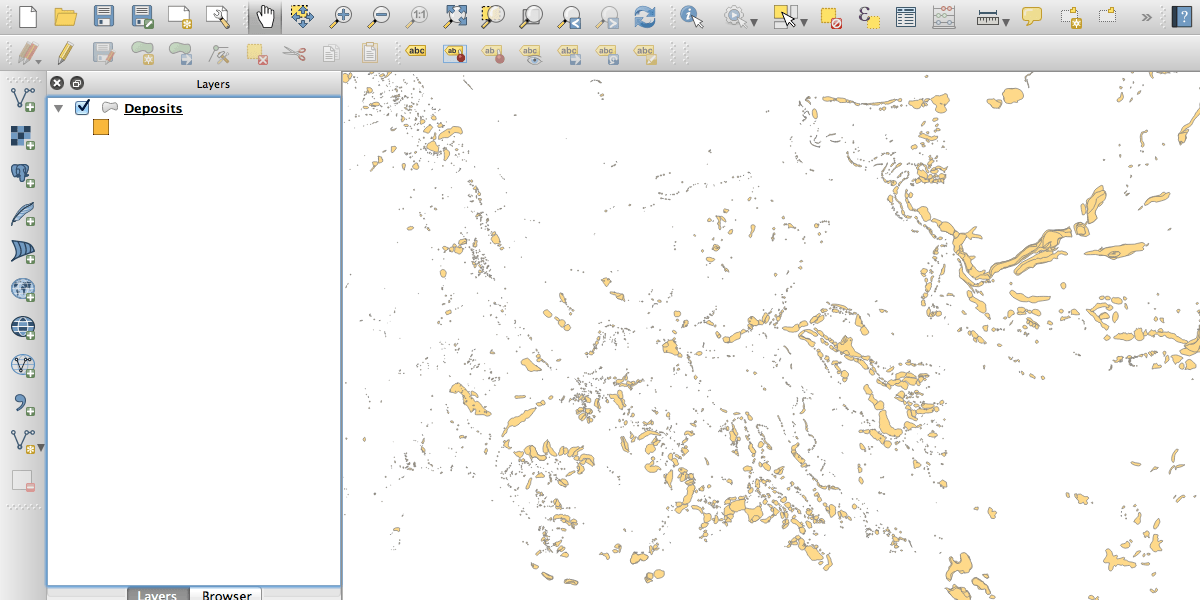
Once that’s done, voila, you should be able to open the file geodatabase in QGIS. You’ll see that there are over a half dozen different layers in the database including deposits.
Map Styling
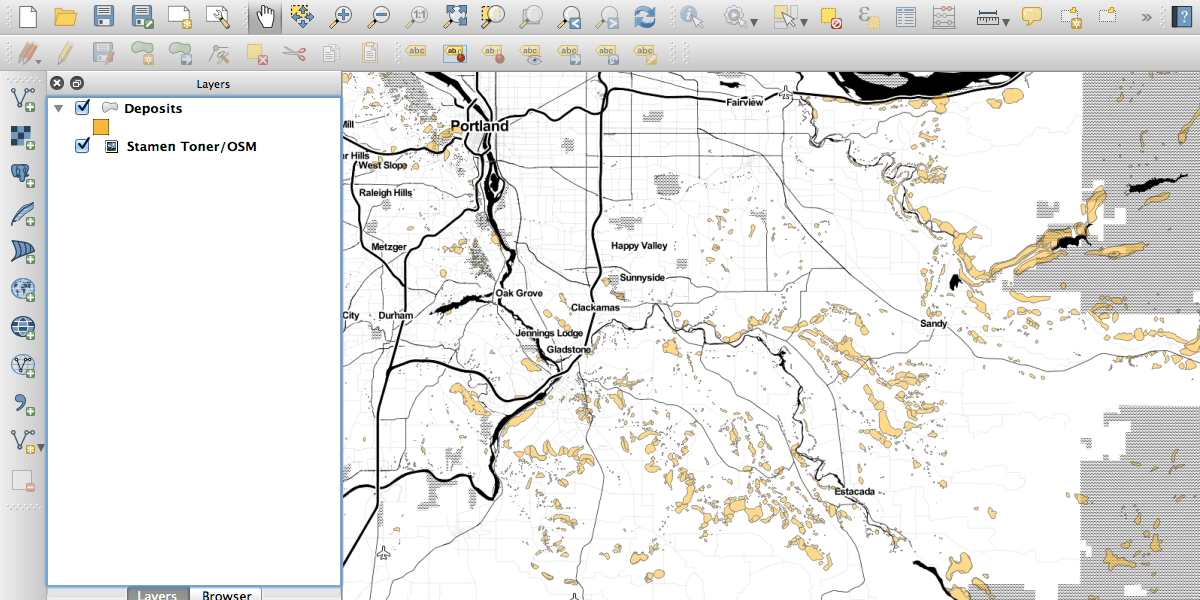
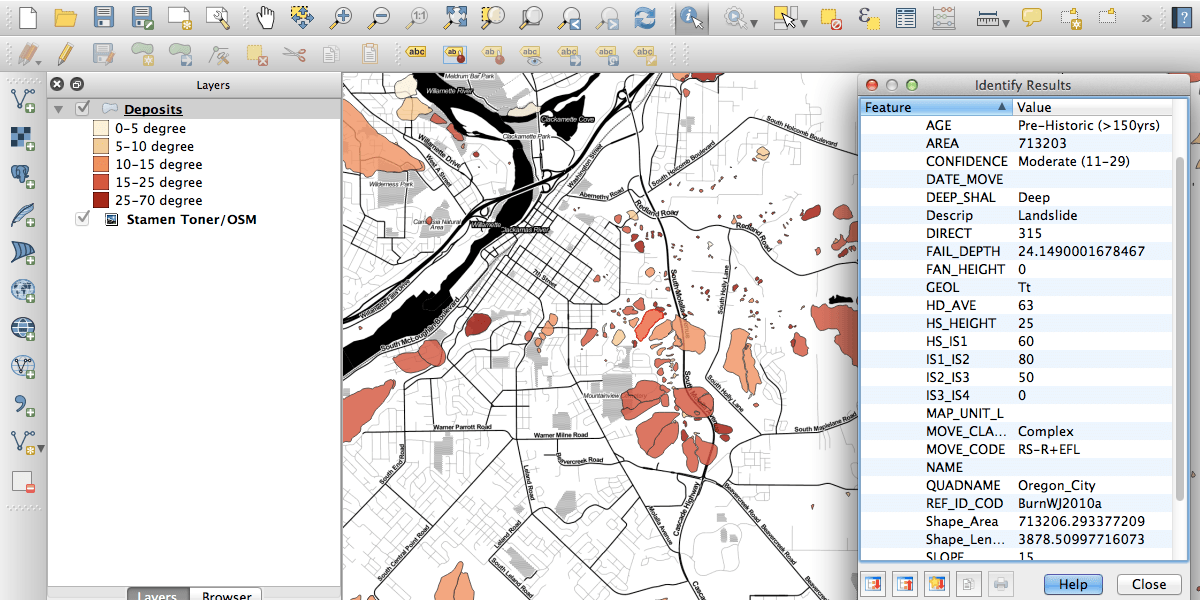
From here I added the Toner basemap produced by Stamen Design, and available through the QGIS OpenLayers Plugin. Then I added a graduated style to the deposits layer based on the slope attribute. The result is a map that lets you begin to get a sense for where steep slides are occurring and just how many low-angle slides there are. Fascinating stuff.
Converting to GeoJSON and TopoJSON
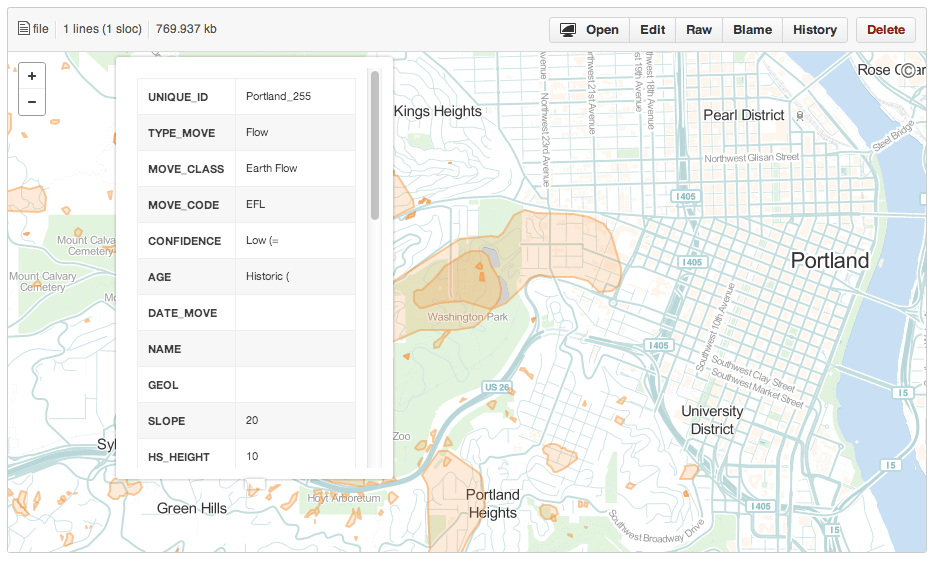
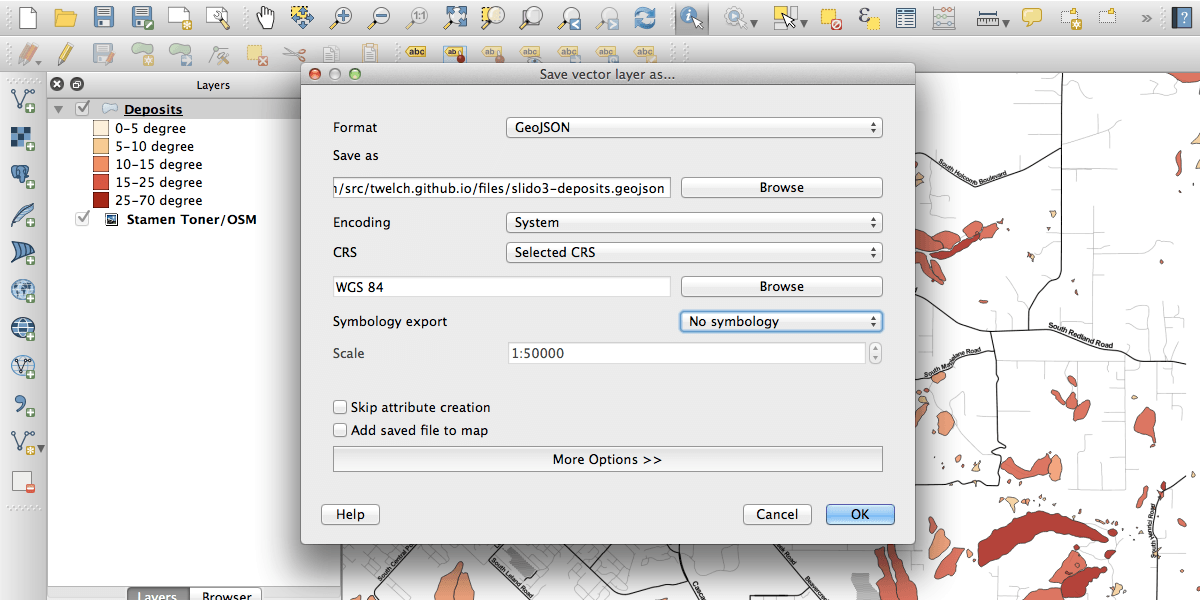
From this point I wanted to break a subset of this data out into a more web-friendly JSON-based format to play with. QGIS has a handy feature called Select features by polygon that let me outline deposits in the Portland area that I want to keep. I then exported these features to GeoJSON by right-clicking the deposits layer and choosing Save selection as…. I needed to to choose the WGS84 coordinate reference system (latitude/longitude) because many web-based tools expect it.
It’s important to note that the GeoJSON format is text-based and fairly verbose. The resulting GeoJSON file I created for the greater Portland area has 983 features and comes in at over 2MB. We can trim this size down even further by converting to the TopoJSON format.
QGIS doesn’t yet support TopoJSON but we can quickly convert the GeoJSON we created over to TopoJSON using a small command-line utility. To install the TopoJSON utility on OSX I used the Homebrew and NPM package managers:
brew install npm
npm install -g topojson
topojson -p -o slido3-deposits-pdx.topojson slido3-deposits-pdx.geojson
Be sure to use the -p option to maintain the attributes for each feature. The resulting topojson file is less than 800KB, an over 60% reduction in size.
As an alternative to the command-line, you can use Josh Livni’s Shape Escape application to convert from a shapefile to TopoJSON.
GitHub
Now that my data is in the GeoJSON and TopoJSON format, I can use it in a variety of web-based tools which I’ll save for another post. To kick that off I pushed both files to GitHub for safekeeping and quick access. GitHub recently added support for visualizing both GeoJSON and TopoJSON files from within a repository which is handy for making sure everything worked properly.